Generate Q-Q plot using Python (Install StatsModels Ubuntu 12.10)
While I prefer C or C++ as a programming language, I frequently turn to Python for prototyping and data plotting. R is an absolute last resort if the tools I'm looking for aren't implemented elsewhere.
That said, I was interested in generating a Q-Q plot for some phenotype data, and wanted to do so in a way that did not involve R. Fortunately, it is already implemented in the StatsModels package for Python.
Regarding the theory behind Q-Q plots, I found this documentation very helpful.
First I grabbed setuptools to make the installation easier:
So I went to the StatsModels page on pypi and downloaded the source there (statsmodels-0.5.0.tar.gz). After decompression and moving to the directory in the terminal:
To test that against R, from the R interpreter you can do:

That said, I was interested in generating a Q-Q plot for some phenotype data, and wanted to do so in a way that did not involve R. Fortunately, it is already implemented in the StatsModels package for Python.
Regarding the theory behind Q-Q plots, I found this documentation very helpful.
First I grabbed setuptools to make the installation easier:
sudo ls    #I just ran this so that the next command didn't prompt for a password on the sudo python command
wget https://bootstrap.pypa.io/ez_setup.py -O - | sudo python
Unfortunately, the the StatModels instructions page command for setuptools didn't work:
sudo easy_install -U statsmodels #This didn't work for meThe command failed, stating that there was a SandboxViolation because the setup script attempted to modify files on the system that were not within the EasyInstall build area (it looked like it was matplotlib, which I had installed long ago).
So I went to the StatsModels page on pypi and downloaded the source there (statsmodels-0.5.0.tar.gz). After decompression and moving to the directory in the terminal:
python setup.py buildI was lacking a few dependencies; fortunately, getting them with setuptools worked and was as easy as:
sudo easy_install -U pandas
sudo easy_install -U patsy
sudo easy_install -U openpyxl
Then, once again for StatsModels:
python setup.py build
sudo python setup.py install
You can test the installation by going into the Python interpreter and trying to import it.
python
>>> import statsmodels.api as sm
This threw some warnings stating my lxml was too old to be used with openpyxl. To resolve that I tried:
sudo apt-get build-dep python-lxmlThis didn't fix this issue for me, but it sounds like it's not necessary, at least according to this StackOverflow post. At any rate, at this point, you should be able to open the Python interpreter and run (this code is from the StatsModels documentation):
>>> import statsmodels.api as sm
>>> from matplotlib import pyplot as plt
>>> data = sm.datasets.longley.load()
>>> data.exog = sm.add_constant(data.exog)
>>> mod_fit = sm.OLS(data.endog, data.exog).fit()
>>> res = mod_fit.resid # residuals
>>> fig = sm.qqplot(res)
>>> plt.show()
And get a plot. Alright, so StatsModels is working for us now. Onto making a Q-Q plot with our data. I had a .tsv file named data.tsv of the format (single column of floats):
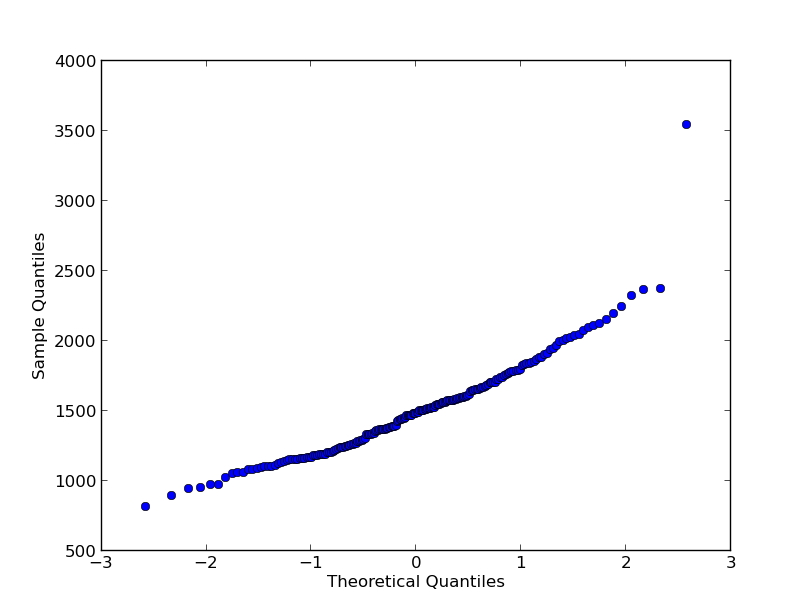
1296.667
1156.667
1329.167
...
1640.5
And I wrote the following code in normalityTest.py (some of it is extraneous for this example); note that this is the Q-Q plot against the normal distribution, the default distribution for qqplot():
#!/usr/bin/python
# -*- coding: utf-8 -*-

import sys
import statsmodels.api as sm
import numpy as np
from matplotlib import pyplot as plt

def usage():
    sys.stderr.write("\tnormalityTest.py.py input.mds\n")
    sys.stderr.write("\tExample usage: normalityTest.py.py data.tsv\n")
    sys.exit()

try:
    li_tsv = [line.strip() for line in open(sys.argv[1])]
    li_tsv = [element.split("\t") for element in li_tsv]
except IndexError:  # Check if arguments were given
    sys.stderr.write("No arguments received. Please check your input:\n")
    usage()
except IOError:  # Check if file is unabled to be opened.
    sys.stderr.write("Cannot open target file. Please check your input:\n")
    usage()

def plotQQPlot():
    li_x = []

    for i in range(len(li_tsv)):
        li_x.append(float(li_tsv[i][0]))  #Assuming your data are in the first column

    print li_x
    na_x = np.array(li_x)
    fig = sm.qqplot(na_x)
    plt.show()

plotQQPlot()
And ran it with:
python normalityTest.py data.tsvWhich gave:
To test that against R, from the R interpreter you can do:
> data <- readLines("data.tsv")
> dataNum <- as.numeric(data)
> qqnorm(dataNum)
Which gave:

Comments
Post a Comment